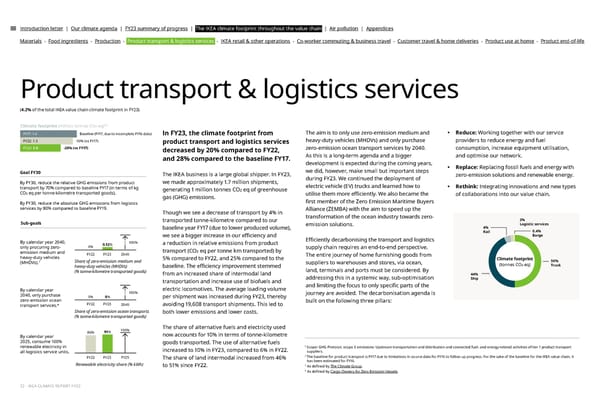
Introduction letter | Our climate agenda | FY23 summary of progress | The IKEA climate footprint throughout the value chain | Air pollution | Appendices Materials - Food ingredients - Production - Product transport & logistics services - IKEA retail & other operations - Co-worker commuting & business travel - Customer travel & home deliveries - Product use at home - Product end-of-life Product transport & logistics services (4.2% of the total IKEA value chain climate footprint in FY23) 1,2 Climate footprint (million tonnes CO2 eq) • Reduce: Working together with our service FY17: 1.4 Baseline (FY17, due to incomplete FY16 data) In FY23, the climate footprint from The aim is to only use zero-emission medium and providers to reduce energy and fuel FY22: 1.3 -10% (vs FY17) product transport and logistics services heavy-duty vehicles (MHDVs) and only purchase FY23: 1.0 -28% (vs FY17) consumption, increase equipment utilisation, decreased by 20% compared to FY22, zero-emission ocean transport services by 2040. and 28% compared to the baseline FY17. As this is a long-term agenda and a bigger and optimise our network. development is expected during the coming years, • Replace: Replacing fossil fuels and energy with Goal FY30 The IKEA business is a large global shipper. In FY23, we did, however, make small but important steps during FY23. We continued the deployment of zero-emission solutions and renewable energy. By FY30, reduce the relative GHG emissions from product we made approximately 1.7 million shipments, electric vehicle (EV) trucks and learned how to • Rethink: Integrating innovations and new types transport by 70% compared to baseline FY17 (in terms of kg generating 1 million tonnes CO2 eq of greenhouse CO2 eq per tonne-kilometre transported goods). utilise them more e昀케ciently. We also became the of collaborations into our value chain. gas (GHG) emissions. By FY30, reduce the absolute GHG emissions from logistics 昀椀rst member of the Zero Emission Maritime Buyers services by 80% compared to baseline FY19. Though we see a decrease of transport by 4% in Alliance (ZEMBA) with the aim to speed up the transported tonne-kilometre compared to our transformation of the ocean industry towards zero- 2% Sub-goals emission solutions. Logistic services 4% baseline year FY17 (due to lower produced volume), Rail 0.4% Barge we see a bigger increase in our e昀케ciency and By calendar year 2040, 100% a reduction in relative emissions from product E昀케ciently decarbonising the transport and logistics 0% 0.12% only procuring zero- supply chain requires an end-to-end perspective. emission medium and FY22 FY23 2040 transport (CO2 eq per tonne km transported) by The entire journey of home furnishing goods from heavy-duty vehicles 5% compared to FY22, and 25% compared to the Climate footprint 50% 3 Share of zero-emission medium and (MHDVs). suppliers to warehouses and stores, via ocean, heavy-duty vehicles (MHDVs) (tonnes CO2 eq) Truck baseline. The e昀케ciency improvement stemmed land, terminals and ports must be considered. By (% tonne-kilometre transported goods) from an increased share of intermodal land 44% transportation and increase use of biofuels and addressing this in a systemic way, sub-optimisation Ship By calendar year electric locomotives. The average loading volume and limiting the focus to only speci昀椀c parts of the 2040, only purchase 100% journey are avoided. The decarbonisation agenda is 0% 0% per shipment was increased during FY23, thereby zero-emission ocean FY22 FY23 built on the following three pillars: transport services.4 2040 avoiding 19,608 transport shipments. This led to Share of zero-emission ocean transports both lower emissions and lower costs. (% tonne-kilometre transported goods) 100% The share of alternative fuels and electricity used 86% 91% now accounts for 10% in terms of tonne-kilometre By calendar year 2025, consume 100% goods transported. The use of alternative fuels renewable electricity in 1 increased to 10% in FY23, compared to 6% in FY22. Scope: GHG Protocol, scope 3 emissions: Upstream transportation and distribution and connected fuel- and energy-related activities of tier 1 product transport all logistics service units. suppliers. 2 FY22 FY23 FY25 The share of land intermodal increased from 46% The baseline for product transport is FY17 due to limitations in source data for FY16 to follow-up progress. For the sake of the baseline for the IKEA value chain, it Renewable electricity share (% kWh) has been estimated for FY16. to 51% since FY22. 3 As de昀椀ned by The Climate Group. 4 As de昀椀ned by Cargo Owners for Zero Emission Vessels. 22 - IKEA CLIMATE REPORT FY23
 IKEA CLIMATE Report FY23 Page 21 Page 23