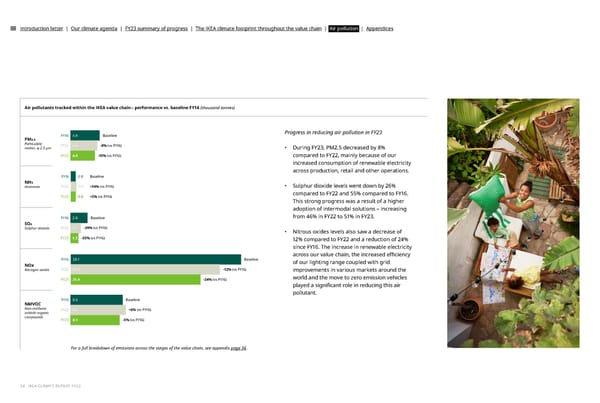
Introduction letter | Our climate agenda | FY23 summary of progress | The IKEA climate footprint throughout the value chain | Air pollution | Appendices Air pollutants tracked within the IKEA value chain– performance vs. baseline FY16 (thousand tonnes) FY16 4.8 Baseline Progress in reducing air pollution in FY23 PM2.5 Particulate FY22 4.4 -8% (vs FY16) matter, ≤ 2.5 µm • During FY23, PM2.5 decreased by 8% FY23 4.0 -15% (vs FY16) compared to FY22, mainly because of our increased consumption of renewable electricity across production, retail and other operations. FY16 0.8 Baseline NH3 • Sulphur dioxide levels went down by 26% Ammonia FY22 0.9 +14% (vs FY16) FY23 0.8 +5% (vs FY16) compared to FY22 and 55% compared to FY16. This strong progress was a result of a higher adoption of intermodal solutions – increasing FY16 2.8 Baseline from 46% in FY22 to 51% in FY23. SO2 Sulphur dioxide FY22 1.7 -39% (vs FY16) • Nitrous oxides levels also saw a decrease of FY23 1.3 -55% (vs FY16) 12% compared to FY22 and a reduction of 24% since FY16. The increase in renewable electricity across our value chain, the increased e昀케ciency FY16 28.1 Baseline of our lighting range coupled with grid NOx Nitrogen oxides FY22 24.6 -12% (vs FY16) improvements in various markets around the FY23 21.4 -24% (vs FY16) world and the move to zero emission vehicles played a signi昀椀cant role in reducing this air pollutant. FY16 8.6 Baseline NMVOC Non-methane FY22 9.1 +6% (vs FY16) volatile organic compounds FY23 8.1 -5% (vs FY16) For a full breakdown of emissions across the stages of the value chain, see appendix page 36. 34 - IKEA CLIMATE REPORT FY23
 IKEA CLIMATE Report FY23 Page 33 Page 35