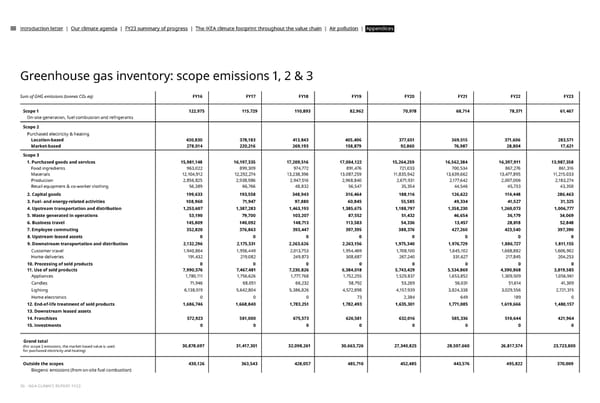
Introduction letter | Our climate agenda | FY23 summary of progress | The IKEA climate footprint throughout the value chain | Air pollution | Appendices Greenhouse gas inventory: scope emissions 1, 2 & 3 Sum of GHG emissions (tonnes CO2 eq) FY16 FY17 FY18 FY19 FY20 FY21 FY22 FY23 Scope 1 122,975 115,729 110,893 82,962 70,978 68,714 78,371 61,467 On-site generation, fuel combustion and refrigerants Scope 2 Purchased electricity & heating Location-based 430,830 378,183 413,843 405,406 377,651 369,515 371,606 283,571 Market-based 278,014 220,216 269,193 158,879 92,860 76,987 28,804 17,621 Scope 3 1. Purchased goods and services 15,981,148 16,197,335 17,209,516 17,004,122 15,264,259 16,562,384 16,397,911 13,987,358 Food ingredients 963,022 899,309 974,772 891,476 721,033 700,534 867,276 861,316 Materials 12,104,912 12,292,274 13,238,396 13,087,259 11,835,942 13,639,662 13,477,895 11,215,033 Production 2,856,825 2,938,986 2,947,516 2,968,840 2,671,931 2,177,642 2,007,006 2,183,274 Retail equipment & co-worker clothing 56,389 66,766 48,832 56,547 35,354 44,546 45,733 43,358 2. Capital goods 199,633 193,558 348,943 316,464 188,116 126,622 114,448 286,463 3. Fuel- and energy-related activities 108,960 71,947 97,880 60,845 55,585 49,334 41,527 31,325 4. Upstream transportation and distribution 1,253,607 1,387,283 1,463,193 1,385,675 1,188,797 1,358,230 1,260,073 1,006,777 5. Waste generated in operations 53,190 79,700 103,207 87,552 51,432 46,654 36,179 34,069 6. Business travel 145,809 140,092 148,713 113,583 54,336 13,457 28,818 52,848 7. Employee commuting 352,820 376,863 393,447 397,395 388,376 427,260 423,540 397,390 8. Upstream leased assets 0 0 0 0 0 0 0 0 9. Downstream transportation and distribution 2,132,296 2,175,531 2,263,626 2,263,156 1,975,340 1,976,729 1,886,727 1,811,155 Customer travel 1,940,864 1,956,449 2,013,753 1,954,469 1,708,100 1,645,102 1,668,882 1,606,902 Home deliveries 191,432 219,082 249,873 308,687 267,240 331,627 217,845 204,253 10. Processing of sold products 0 0 0 0 0 0 0 0 11. Use of sold products 7,990,576 7,467,481 7,230,826 6,384,018 5,743,429 5,534,869 4,390,868 3,819,585 Appliances 1,780,111 1,756,626 1,777,768 1,752,255 1,529,837 1,653,852 1,309,509 1,056,961 Candles 71,946 68,051 66,232 58,792 53,269 56,031 51,614 41,309 Lighting 6,138,519 5,642,804 5,386,826 4,572,898 4,157,939 3,824,338 3,029,556 2,721,315 Home electronics 0 0 0 73 2,384 649 189 0 12. End-of-life treatment of sold products 1,686,746 1,668,840 1,783,251 1,782,493 1,635,301 1,771,085 1,619,666 1,480,157 13. Downstream leased assets 14. Franchises 572,923 581,000 675,573 626,581 632,016 585,336 510,644 421,964 15. Investments 0 0 0 0 0 0 0 0 Grand total (For scope 2 emissions, the market-based value is used 30,878,697 31,417,301 32,098,261 30,663,726 27,340,825 28,597,660 26,817,574 23,723,800 for purchased electricity and heating) Outside the scopes 430,126 363,543 428,057 485,710 452,485 443,576 495,822 370,009 Biogenic emissions (from on-site fuel combustion) 36 - IKEA CLIMATE REPORT FY23
 IKEA CLIMATE Report FY23 Page 35 Page 37