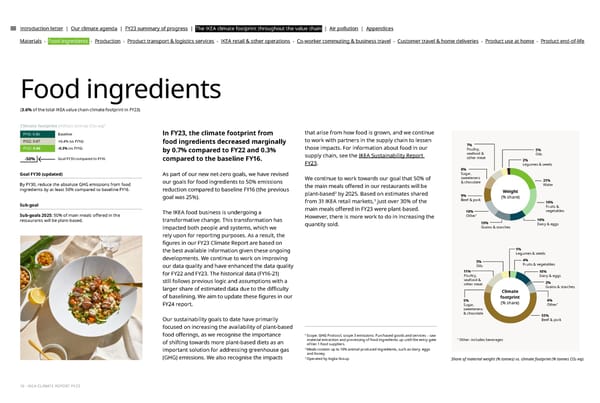
Introduction letter | Our climate agenda | FY23 summary of progress | The IKEA climate footprint throughout the value chain | Air pollution | Appendices Materials - Food ingredients - Production - Product transport & logistics services - IKEA retail & other operations - Co-worker commuting & business travel - Customer travel & home deliveries - Product use at home - Product end-of-life Food ingredients (3.6% of the total IKEA value chain climate footprint in FY23) 1 Climate footprint (million tonnes CO2 eq) FY16: 0.86 Baseline In FY23, the climate footprint from that arise from how food is grown, and we continue FY22: 0.87 +0.4% (vs FY16) food ingredients decreased marginally to work with partners in the supply chain to lessen FY23: 0.86 -0.3% (vs FY16) those impacts. For information about food in our 7% by 0.7% compared to FY22 and 0.3% Poultry, 5% supply chain, see the IKEA Sustainability Report seafood & Oils -50% Goal FY30 compared to FY16 compared to the baseline FY16. other meat 2% FY23. Legumes & seeds 8% Goal FY30 (updated) Sugar, As part of our new net-zero goals, we have revised We continue to work towards our goal that 50% of sweeteners our goals for food ingredients to 50% emissions & chocolate 21% By FY30, reduce the absolute GHG emissions from food Water ingredients by at least 50% compared to baseline FY16. the main meals o昀昀ered in our restaurants will be reduction compared to baseline FY16 (the previous plant-based2 Weight by 2025. Based on estimates shared 9% (% share) goal was 25%). 3 Beef & pork Sub-goal from 31 IKEA retail markets, just over 30% of the 19% Fruits & The IKEA food business is undergoing a main meals o昀昀ered in FY23 were plant-based. 10% vegetables Sub-goals 2025: 50% of main meals o昀昀ered in the * However, there is more work to do in increasing the Other restaurants will be plant-based. transformative change. This transformation has 10% 10% impacted both people and systems, which we quantity sold. Grains & starches Dairy & eggs rely upon for reporting purposes. As a result, the 昀椀gures in our FY23 Climate Report are based on the best available information given these ongoing 1% Legumes & seeds developments. We continue to work on improving 5% 4% our data quality and have enhanced the data quality Oils Fruits & vegetables 11% 10% for FY22 and FY23. The historical data (FY16-21) Poultry, Dairy & eggs still follows previous logic and assumptions with a seafood & 2% other meat Grains & starches larger share of estimated data due to the di昀케culty Climate of baselining. We aim to update these 昀椀gures in our 5% footprint 6% (% share) * FY24 report. Sugar, Other sweeteners & chocolate 55% Our sustainability goals to date have primarily Beef & pork focused on increasing the availability of plant-based 1 food o昀昀erings, as we recognise the importance Scope: GHG Protocol, scope 3 emissions: Purchased goods and services – raw of shifting towards more plant-based diets as an material extraction and processing of food ingredients up until the entry gate * Other: includes beverages of tier 1 food suppliers. 2 important solution for addressing greenhouse gas Meals contain up to 10% animal-produced ingredients, such as dairy, eggs and honey. 3 (GHG) emissions. We also recognise the impacts Operated by Ingka Group Share of material weight (% tonnes) vs. climate footprint (% tonnes CO2 eq). 16 - IKEA CLIMATE REPORT FY23
 IKEA CLIMATE Report FY23 Page 15 Page 17