
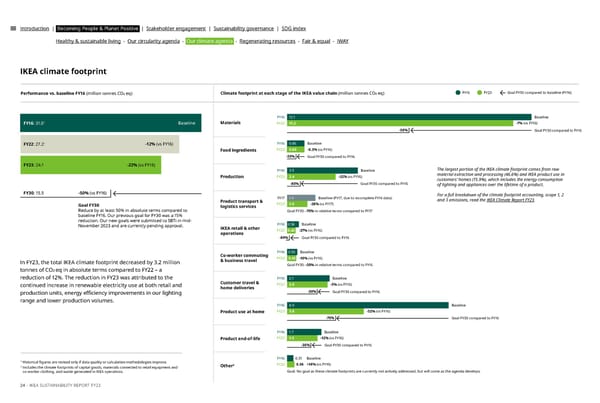
Introduction | Becoming People & Planet Positive | Stakeholder engagement | Sustainability governance | SDG index Healthy & sustainable living - Our circularity agenda - Our climate agenda - Regenerating resources - Fair & equal - IWAY IKEA climate footprint Performance vs. baseline FY16 (million tonnes CO2 eq) Climate footprint at each stage of the IKEA value chain (million tonnes CO2 eq) FY16 FY23 Goal FY30 compared to baseline (FY16) FY16 12.1 Baseline 1 Baseline Materials FY23 11.2 -7% (vs FY16) FY16: 31.0 -50% Goal FY30 compared to FY16 1 -12% (vs FY16) FY16 0.86 Baseline FY22: 27.2 Food ingredients FY23 0.86 -0.3% (vs FY16) -50% Goal FY30 compared to FY16 FY23: 24.1 -22% (vs FY16) FY16 3.5 Baseline The largest portion of the IKEA climate footprint comes from raw Production FY23 2.4 -32% (vs FY16) material extraction and processing (46.6%) and IKEA product use in customers’ homes (15.9%), which includes the energy consumption -80% Goal FY30 compared to FY16 of lighting and appliances over the lifetime of a product. FY30: 15.5 -50% (vs FY16) FY17 1.4 Baseline (FY17, due to incomplete FY16 data) For a full breakdown of the climate footprint accounting, scope 1, 2 Product transport & and 3 emissions, read the IKEA Climate Report FY23. Goal FY30 logistics services FY23 1.0 -28% (vs FY17) Reduce by at least 50% in absolute terms compared to Goal FY30: -70% in relative terms compared to FY17 baseline FY16. Our previous goal for FY30 was a 15% reduction. Our new goals were submitted to SBTi in mid- FY16 0.58 Baseline November 2023 and are currently pending approval. IKEA retail & other operations FY23 0.42 -27% (vs FY16) -80% Goal FY30 compared to FY16 Co-worker commuting FY16 0.50 Baseline In FY23, the total IKEA climate footprint decreased by 3.2 million & business travel FY23 0.45 -10% (vs FY16) Goal FY30: -50% in relative terms compared to FY16 tonnes of CO2eq in absolute terms compared to FY22 – a reduction of 12%. The reduction in FY23 was attributed to the FY16 2.1 Baseline continued increase in renewable electricity use at both retail and Customer travel & FY23 2.0 -5% (vs FY16) home deliveries -30% Goal FY30 compared to FY16 production units, energy e昀케ciency improvements in our lighting range and lower production volumes. FY16 8.0 Baseline Product use at home FY23 3.8 -52% (vs FY16) -70% Goal FY30 compared to FY16 FY16 1.7 Baseline Product end-of-life FY23 1.5 -12% (vs FY16) -30% Goal FY30 compared to FY16 FY16 0.31 Baseline 1 Historical 昀椀gures are revised only if data quality or calculation methodologies improve. 2 FY23 0.36 +18% (vs FY16) 2 Includes the climate footprints of capital goods, materials connected to retail equipment and Other co-worker clothing, and waste generated in IKEA operations. Goal: No goal as these climate footprints are currently not actively addressed, but will come as the agenda develops 24 - IKEA SUSTAINABILITY REPORT FY23
 IKEA ESG FY23 Report Page 23 Page 25