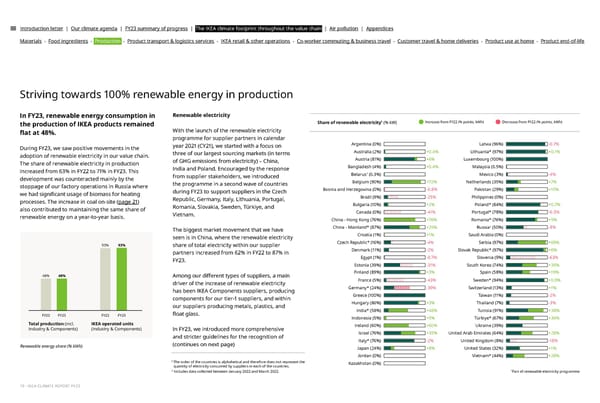
Introduction letter | Our climate agenda | FY23 summary of progress | The IKEA climate footprint throughout the value chain | Air pollution | Appendices Materials - Food ingredients - Production - Product transport & logistics services - IKEA retail & other operations - Co-worker commuting & business travel - Customer travel & home deliveries - Product use at home - Product end-of-life Striving towards 100% renewable energy in production In FY23, renewable energy consumption in Renewable electricity 1 the production of IKEA products remained Share of renewable electricity (% kW) Increase from FY22 (% points, kWh) Decrease from FY22 (% points, kWh) With the launch of the renewable electricity 昀氀at at 48%. programme for supplier partners in calendar Argentina (0%) Latvia (96%) -0.7% During FY23, we saw positive movements in the year 2021 (CY21), we started with a focus on Australia (2%) +0.4% Lithuania* (97%) +0.1% adoption of renewable electricity in our value chain. three of our largest sourcing markets (in terms Austria (81%) +6% Luxembourg (100%) The share of renewable electricity in production of GHG emissions from electricity) – China, increased from 63% in FY22 to 71% in FY23. This India and Poland. Encouraged by the response Bangladesh (4%) +0.4% Malaysia (0.5%) 2 development was counteracted mainly by the from supplier stakeholders, we introduced Belarus (0.3%) Mexico (3%) -4% stoppage of our factory operations in Russia where the programme in a second wave of countries Belgium (90%) +72% Netherlands (35%) +7% Bosnia and Herzegovina (0%) -0.8% Pakistan (29%) +10% during FY23 to support suppliers in the Czech we had signi昀椀cant usage of biomass for heating Republic, Germany, Italy, Lithuania, Portugal, Brazil (9%) -25% Philippines (0%) processes. The increase in coal on-site (page 21) also contributed to maintaining the same share of Romania, Slovakia, Sweden, Türkiye, and Bulgaria (10%) +2% Poland* (84%) +0.7% renewable energy on a year-to-year basis. Vietnam. Canada (0%) -41% Portugal* (78%) -0.5% China - Hong Kong (76%) +76% Romania* (76%) +5% 2 The biggest market movement that we have China - Mainland* (87%) +25% Russia (50%) -8% seen is in China, where the renewable electricity Croatia (1%) +1% Saudi Arabia (0%) 93% 93% share of total electricity within our supplier Czech Republic* (16%) -4% Serbia (97%) +69% partners increased from 62% in FY22 to 87% in Denmark (11%) -2% Slovak Republic* (97%) +6% FY23. Egypt (1%) -0.7% Slovenia (9%) -63% Estonia (39%) -31% South Korea (74%) +35% 48% 48% Finland (89%) +3% Spain (58%) +19% Among our di昀昀erent types of suppliers, a main France (5%) -43% Sweden* (94%) +0.9% driver of the increase of renewable electricity Germany* (24%) -39% Switzerland (13%) +1% has been IKEA Components suppliers, producing Greece (100%) Taiwan (11%) -2% components for our tier-1 suppliers, and within Hungary (86%) +3% Thailand (7%) -3% our suppliers producing metals, plastics, and India* (58%) +48% Tunisia (91%) +38% FY22 FY23 FY22 FY23 昀氀oat glass. Indonesia (5%) +5% Türkiye* (67%) +36% Total production (incl. IKEA operated units Ireland (60%) +60% Ukraine (39%) Industry & Components) (Industry & Components) In FY23, we introduced more comprehensive and stricter guidelines for the recognition of Israel (76%) +35% United Arab Emirates (64%) +28% (continues on next page) Italy* (76%) -2% United Kingdom (8%) -18% Renewable energy share (% kWh) Japan (24%) +8% United States (32%) +1% Jordan (0%) Vietnam* (44%) +28% 1 The order of the countries is alphabetical and therefore does not represent the quantity of electricity consumed by suppliers in each of the countries. Kazakhstan (0%) 2 * Includes data collected between January 2022 and March 2022. Part of renewable electricity programme 19 - IKEA CLIMATE REPORT FY23
 IKEA CLIMATE Report FY23 Page 18 Page 20