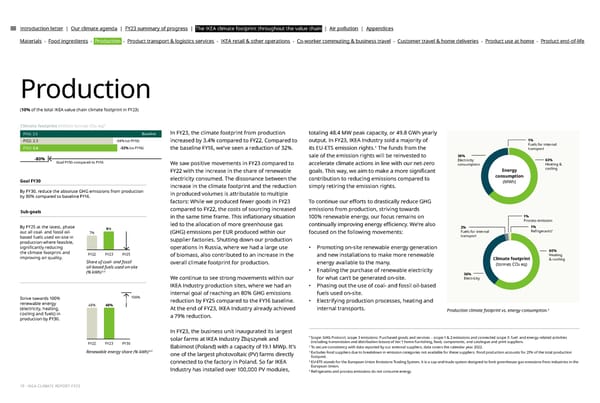
Introduction letter | Our climate agenda | FY23 summary of progress | The IKEA climate footprint throughout the value chain | Air pollution | Appendices Materials - Food ingredients - Production - Product transport & logistics services - IKEA retail & other operations - Co-worker commuting & business travel - Customer travel & home deliveries - Product use at home - Product end-of-life Production (10% of the total IKEA value chain climate footprint in FY23) 1 Climate footprint (million tonnes CO2 eq) FY16: 3.5 Baseline In FY23, the climate footprint from production totaling 48.4 MW peak capacity, or 49.8 GWh yearly FY22: 2.3 output. In FY23, IKEA Industry sold a majority of 1% -34% (vs FY16) increased by 3.4% compared to FY22. Compared to Fuels for internal FY23: 2.4 -32% (vs FY16) 4 the baseline FY16, we've seen a reduction of 32%. its EU-ETS emission rights. The funds from the transport -80% sale of the emission rights will be reinvested to 36% Goal FY30 compared to FY16 Electricity 63% We saw positive movements in FY23 compared to accelerate climate actions in line with our net-zero consumption Heating & FY22 with the increase in the share of renewable goals. This way, we aim to make a more signi昀椀cant Energy cooling electricity consumed. The dissonance between the contribution to reducing emissions compared to consumption Goal FY30 increase in the climate footprint and the reduction simply retiring the emission rights. (MWh) By FY30, reduce the absolute GHG emissions from production in produced volumes is attributable to multiple by 80% compared to baseline FY16. factors: While we produced fewer goods in FY23 To continue our e昀昀orts to drastically reduce GHG Sub-goals compared to FY22, the costs of sourcing increased emissions from production, striving towards 1% in the same time frame. This in昀氀ationary situation 100% renewable energy, our focus remains on Process emission led to the allocation of more greenhouse gas By FY25 at the latest, phase continually improving energy e昀케ciency. We're also 2% 1% 9% 5 out all coal- and fossil oil- Fuels for internal Refrigerants 7% (GHG) emissions per EUR produced within our focused on the following movements: transport based fuels used on-site in supplier factories. Shutting down our production production where feasible, signi昀椀cantly reducing operations in Russia, where we had a large use • Promoting on-site renewable energy generation 60% the climate footprint and FY22 FY23 FY25 of biomass, also contributed to an increase in the and new installations to make more renewable Heating improving air quality. Share of coal- and fossil overall climate footprint for production. energy available to the many. Climate footprint & cooling oil-based fuels used on-site (tonnes CO2 eq) (% kWh)2,3 • Enabling the purchase of renewable electricity 36% We continue to see strong movements within our for what can’t be generated on-site. Electricity IKEA Industry production sites, where we had an • Phasing out the use of coal- and fossil oil-based internal goal of reaching an 80% GHG emissions fuels used on-site. Strive towards 100% 100% reduction by FY25 compared to the FY16 baseline. • Electrifying production processes, heating and renewable energy 48% 48% (electricity, heating, At the end of FY23, IKEA Industry already achieved internal transports. 3 Production climate footprint vs. energy consumption. cooling and fuels) in a 79% reduction. production by FY30. In FY23, the business unit inaugurated its largest 1 Scope: GHG Protocol, scope 3 emissions: Purchased goods and services – scope 1 & 2 emissions and connected scope 3: fuel- and energy-related activities solar farms at IKEA Industry Zbąszynek and FY22 FY23 FY30 (including transmission and distribution losses) of tier 1 home furnishing, food, components, and catalogue and print suppliers. 2 To secure consistency with data reported by our external suppliers, data covers the calendar year 2022. Babimost (Poland) with a capacity of 19.1 MWp. It's Renewable energy share (% kWh)2,3 3 Excludes food suppliers due to breakdown in emission categories not available for these suppliers. Food production accounts for 21% of the total production one of the largest photovoltaic (PV) farms directly footprint. 4 connected to the factory in Poland. So far IKEA EU-ETS stands for the European Union Emissions Trading System. It is a cap-and-trade system designed to limit greenhouse gas emissions from industries in the Industry has installed over 100,000 PV modules, European Union. 5 Refrigerants and process emissions do not consume energy. 18 - IKEA CLIMATE REPORT FY23
 IKEA CLIMATE Report FY23 Page 17 Page 19